Own It Northwest / Original MLS Research
Entry-Price Condo Asking Prices and Ownership-Cost Gaps
SUPPLIED-SAMPLE RESEARCH · REPORT 3
Not a complete-market inventory count. Search filters and export completeness remain unconfirmed.
Own It Northwest · Prepared September 22, 2026 (America/Denver) · Source edition: supplied September 22, 2026.
Research question
Portland-Area Condos at $400,000 and Below: Price and Cost Questions
Findings
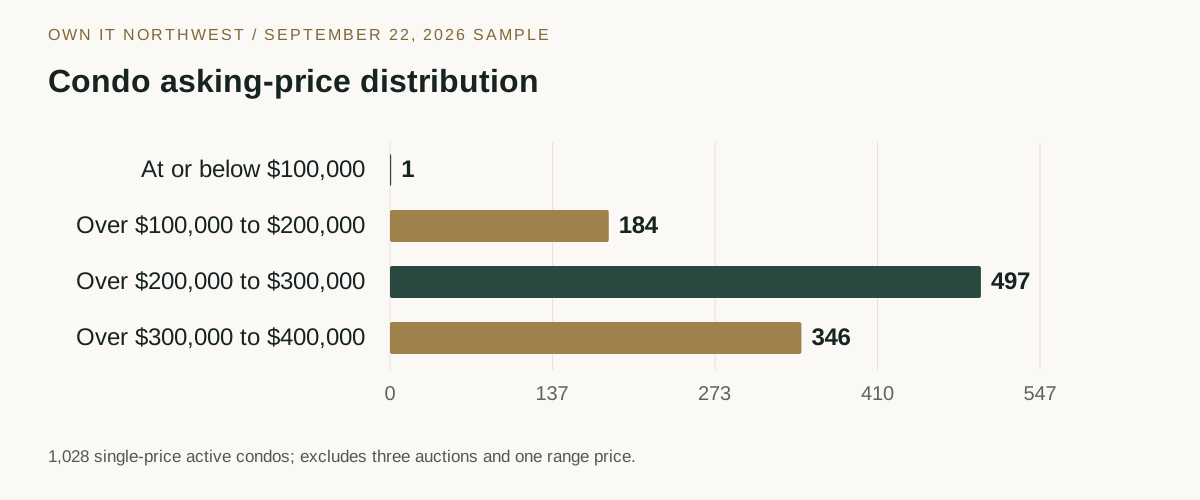
- The export contains 1,032 active CONDO records, of which 1,028 have a single numeric asking price.
- 682 of 1,028 priced condos are at or below $300,000 (66.3%).
- Median condo asking price is $275,000; ownership costs are not present.
Population and data treatment
This is an analysis of the MLS export supplied to Own It Northwest on September 22, 2026. The file contains exactly 2,000 records: 1,732 marked ACT and 268 marked SLD. Original search settings, the complete matching-result count, and the data cutoff are unconfirmed. Results describe this supplied sample, not all Portland-area inventory. The sold records are excluded from these six active-listing studies.
This study's selected classification population contains 1,032 active records. The table names the priced and all-record denominators separately where applicable. Counts use distinct MLS identifiers. Asking-price statistics use one positive numeric List Price per active record; six AUCTION values and one price range are excluded from numeric summaries, not assigned a price. All 1,725 remaining active asking prices are at or below $400,000. The numeric median is $290,000, but it combines very different property forms and is not a citywide home-value estimate. Prices and statuses may have changed since export. There is no separate closing price, square footage, bedroom count, HOA due, space-rent amount, or moorage fee in this file. Tran is not interpreted as a listing, contract, closing, or days-on-market measure.
Results
Scroll the chart horizontally on small screens.
| MLS area | Condo records | Single-price records | At or below $300,000 | Median asking price |
|---|---|---|---|---|
| N Portland (141) | 84 | 84 | 56 | $267,700 |
| NE Portland (142) | 109 | 109 | 84 | $242,500 |
| SE Portland (143) | 113 | 113 | 71 | $295,000 |
| Gresham/Troutdale (144) | 42 | 42 | 35 | $237,450 |
| Milwaukie/Clackamas (145) | 38 | 38 | 33 | $230,000 |
| Oregon City/Canby (146) | 2 | 2 | 1 | Small sample: omitted |
| Lake Oswego/West Linn (147) | 67 | 67 | 39 | $289,900 |
| W Portland (148) | 305 | 303 | 195 | $279,000 |
| NW Washington County (149) | 34 | 34 | 21 | $282,500 |
| Beaverton/Aloha (150) | 136 | 136 | 91 | $279,450 |
| Tigard/Wilsonville (151) | 60 | 59 | 40 | $262,000 |
| Hillsboro/Forest Grove (152) | 42 | 41 | 16 | $324,000 |
Interpretation
The price distribution helps organize a condo search. It cannot establish total monthly cost, association financial health, project loan eligibility or a matched location premium. Association costs require individual building documents.
The export contains MLS area codes 141 through 152. Labels follow the RMLS area report in its January 2024 Market Action publication; this is a label crosswalk, not a reconstruction of the original search boundary. MLS areas can include multiple communities and do not establish city, ZIP, neighborhood, school, or municipal-policy boundaries. No Washington-state listings or wider Portland metro coverage are inferred.
Reproduction and checks
The computation filters Status=ACT, preserves source property classifications and uses exact numeric prices without imputation. The private reproducible script generates this study from the hash-bound input. All six selected-group totals reconcile. Source SHA-256: c1a19115a74946f60075d15b75d9cc1e6ad3fc8150dea15652063f6520724c82. The public CSV contains aggregates and can reproduce the displayed counts and band shares; raw private source records are needed to recompute medians, because medians of subgroups must not be averaged.
Known gaps and follow-up
Confirm the original search filters, full matching-result count, export cap and data cutoff. Obtain complete export batches if needed. For property-level comparisons, request current and original asking prices, closing prices and defined dates, area/address, size, rooms, ownership fields, association dues, space rent, moorage terms and detailed feature documentation. No statistical confidence interval or population estimate is claimed from this unverified selection.
Sources
- Supplied seligman1.csv, September 22, 2026; 2,000 records, 20 columns.
- RMLS Market Action, January 2024, area report (page 10): Area code-to-label crosswalk only. Not current market statistics or exact municipal boundaries.
- CFPB: Condo and HOA fees: HOA dues usually paid separately from mortgage-servicer payment.
- CFPB: Costs of taking out a mortgage: Separate borrowing costs, property taxes, insurance, and other ownership costs.
Use and citation
Read the public companion article. Cite: Own It Northwest, “Entry-Price Condo Asking Prices and Ownership-Cost Gaps,” September 22, 2026 supplied MLS sample, Report 3. The article is the primary indexable presentation; this supporting report supplies the analytical record.