Published October 6, 2026 · Supplied MLS export · Retrieved October 6, 2026
Observed data
| Property code | At or below $400,000 | $400,001 to $500,000 |
|---|---|---|
| ATTACHD | 137 | 104 |
| CONDO | 784 | 119 |
| DETACHD | 195 | 444 |
| FLTHOME | 41 | 11 |
| IN-PARK | 139 | 0 |
| PLNCOMM | 1 | 0 |
| RES-MFG | 14 | 5 |
Chart
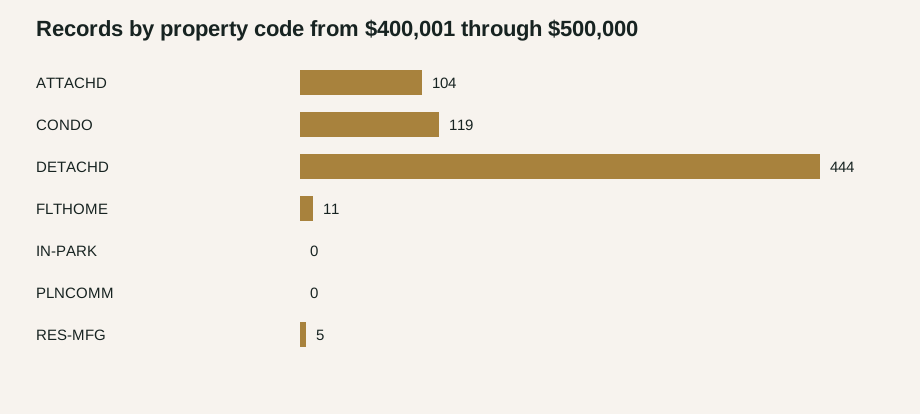
Chart method: horizontal bar length is the labeled record count; categories are the table rows and the chart uses a zero baseline.
What this can help you do
For a buyer deciding whether to stretch a ceiling, separate the property forms you will consider before comparing the two bands. The counts describe the received file's choices, not availability in a complete market. Request current listing documents and compare ownership structure, condition and recurring costs at the property level.
Method and limits
The band boundaries are non-overlapping: at or below $400,000 and over $400,000 through $500,000. A price band is not a property-quality or value category. Asking-price calculations include the 1,994 positive numeric List Price values and exclude six literal AUCTION values. The export has no sale-price, days-on-market, size, or condition field. Tran is not interpreted as timing. Medians appear only for groups with at least 25 numeric prices; this display threshold is not a statistical guarantee.
Source: Own It Northwest analysis of a user-supplied MLS export retrieved October 6, 2026. Raw records and identifiers are private. Read the companion interpretation · Full methodology · Download aggregate CSV · Research library