Published October 6, 2026 · Supplied MLS export · Retrieved October 6, 2026
Observed data
| Field | Y | N | Blank |
|---|---|---|---|
| Floating Home Y/N | 41 | 1940 | 19 |
| Manufactured Y/N | 139 | 1842 | 19 |
| ADU Y/N | 8 | 1973 | 19 |
| Green/Energy YN | 398 | 1583 | 19 |
Chart
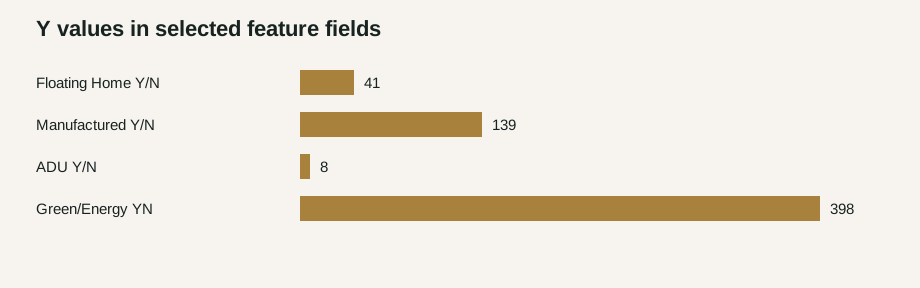
Chart method: horizontal bar length is the labeled record count; categories are the table rows and the chart uses a zero baseline.
What this can help you do
Use the exact search field needed for the question, then inspect what it includes. An MLS flag can help identify candidates, but this export does not define field semantics, verify permits, establish rent or savings, or measure a price premium.
Method and limits
Cross-tabs inspected: FLTHOME with Floating Home Y = 41 of 52; IN-PARK with Manufactured Y = 139 of 139; RES-MFG with Manufactured Y = 0 of 19. ADU Y = 8, Green/Energy Y = 398, and each listed flag has 19 blanks. Blanks remain unknown. Asking-price calculations include the 1,994 positive numeric List Price values and exclude six literal AUCTION values. The export has no sale-price, days-on-market, size, or condition field. Tran is not interpreted as timing. Medians appear only for groups with at least 25 numeric prices; this display threshold is not a statistical guarantee.
Source: Own It Northwest analysis of a user-supplied MLS export retrieved October 6, 2026. Raw records and identifiers are private. Read the companion interpretation · Full methodology · Download aggregate CSV · Research library