

What a Green/Energy MLS Flag Shows in a Portland-Area Sample
268 of 1732 active records are marked Green/Energy Y (15.5%). Supplied-sample research; complete-market coverage unconfirmed.
Research edition
September 22, 2026 supplied MLS sample
Green/Energy Flag Coverage and Property-Type Differences - derived MLS sample aggregates · 1,732 records in the supplied snapshot.
In the supplied Portland-area MLS export, 268 of 1,732 active records are marked Green/Energy Y, or 15.5%. That is a count of an exported field value. It is not the share of all Portland homes that are energy efficient, and it does not measure utility savings or resale value.
Scope: supplied MLS sample, September 22, 2026. Search filters, the complete result count, and the export cutoff are unconfirmed. These are sample findings, not a census of Portland-area homes. Asking prices and listing status are historical observations from this file.
Count the field without changing its meaning
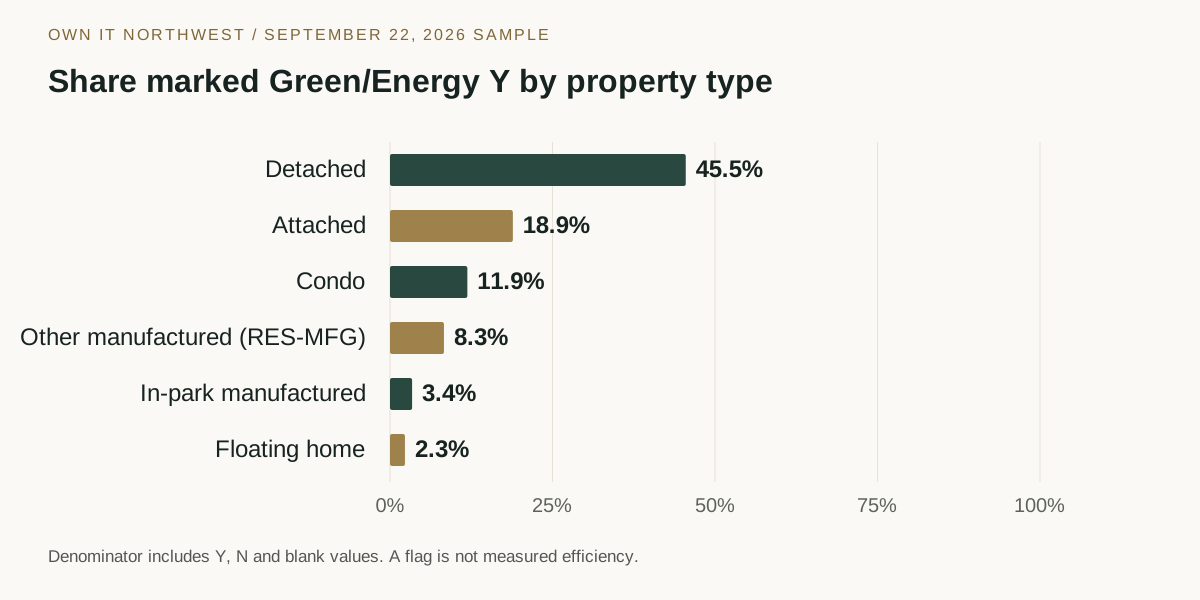
The active sample has 268 Y values, 1457 N values, and 7 blanks. Blank values remain unknown rather than being converted to N. Percentages below use all records in the category as the denominator, including blanks.
| Property category | Y | N | Blank | All records | Y share of all records |
|---|---|---|---|---|---|
| Unclassified | 1 | 4 | 1 | 6 | 16.7% |
| Attached | 44 | 188 | 1 | 233 | 18.9% |
| Condo | 123 | 909 | 0 | 1032 | 11.9% |
| Detached | 91 | 105 | 4 | 200 | 45.5% |
| Floating home | 1 | 43 | 0 | 44 | 2.3% |
| In-park manufactured | 7 | 196 | 0 | 203 | 3.4% |
| Planned community | 0 | 2 | 0 | 2 | 0.0% |
| Other manufactured (RES-MFG) | 1 | 10 | 1 | 12 | 8.3% |
The marked-Y rate differs by property type: 45.5% for the 200 detached records and 11.9% for the 1,032 condo records. That does not show that detached homes perform better. Listing practices, eligible forms, the represented feature, and the property mix may differ. This export supplies no evidence that would isolate those explanations.
What is still unknown about Green/Energy Y?
The CSV does not include the underlying feature list, certification, Home Energy Score, equipment details, or supporting documents. It also does not supply the current field dictionary explaining exactly how this particular Y/N field is populated.
RMLS's 2015 announcement of its Green/Energy Supplement documents a place for certification, solar, and related remarks. That historical context does not establish the precise meaning of every Y value in this 2026 export. For a shortlisted home, ask for the complete supplement and the document supporting the represented feature.
An energy report answers a different question
Portland's Home Energy Score guidance for buyers explains that the score estimates energy use from a home's characteristics and systems. It is distinct from the current occupants' actual bills. Its estimated costs can help frame a comparison, but they are not a promise of your future expenses.
The same guidance explains that city boundaries and property exceptions matter. A Portland mailing address or an MLS area name does not by itself establish whether the city program applies. This study does not audit compliance with that program.
A better buyer evidence trail
For a listing described as having energy features, collect the exact feature, product or system information, available certification or assessment, assessment date, and relevant installation or service documentation. For solar, establish the ownership or payment arrangement in the transaction documents. For a Home Energy Score, read the full report and its assumptions rather than relying on the score alone.
Then compare the evidence with the inspection and the property's actual utility information where available. The MLS flag can prompt that inquiry; it cannot complete it.
Questions buyers ask
Does N mean the home lacks efficient features? This file does not establish that. N is the observed field value, not an independent inspection result.
Can the study calculate an energy-price premium? No. It lacks verified feature specifications, comparable property characteristics, and closing prices.
Can it estimate bill savings? No. It has no consumption, tariff, equipment-performance, or occupant-use data.
Use the flag to ask a precise question
Ask Own It Northwest to help obtain the full listing information and identify which claim needs documentation. For purchase-price context, start with the housing-choice study. Keep the budget comparison and the energy-performance review as separate pieces of the decision.
Source and method
This is an analysis of the MLS export supplied to Own It Northwest on September 22, 2026. The file contains exactly 2,000 records: 1,732 marked ACT and 268 marked SLD. Original search settings, the complete matching-result count, and the data cutoff are unconfirmed. Results describe this supplied sample, not all Portland-area inventory. The sold records are excluded from these six active-listing studies.
Price calculations exclude auctions and range prices. Property codes are preserved; MLS area labels are broader reporting areas. Read the complete methodology, supporting report, and aggregate CSV.
- RMLS: 2015 introduction of Green/Energy Supplement: Historical form context, not proof of the precise 2026 export-flag semantics or a property's features.
- City of Portland: Home buyers and Home Energy Score: HES uses physical characteristics and estimated typical use, not current occupant bills; city boundaries and property exceptions matter.
- RMLS Market Action, January 2024, area report (page 10): Area code-to-label crosswalk only. Not current market statistics or exact municipal boundaries.
Suggested citation: Own It Northwest, “What a Green/Energy MLS Flag Shows in a Portland-Area Sample,” September 22, 2026 supplied MLS sample, https://ownitnorthwest.net/blog/portland-green-energy-listings-2026-09.
Talk to the team
Ready to make your move in Oregon or Washington?
Whether you’re buying, selling, or just thinking it through, the Own It Northwest team is happy to talk. No pressure — just clear answers from people who know the market.